Having a fast loading website is essential for any business that needs to remain competitive on the web and make a first good impression on its customers. Websites that load fast attract more customers and perform better in search engines. On the other hand, a slow website will cause a lack of sales conversions and a general loss of traffic for a business.
There are a lot of tools and options available for business owners when it comes to testing their sites for page speed and performance. During this article, we are going to have an in-depth look at the GTMetrix speed test tool and how you can use it to successfully measure website performance.
What is GT Metrix?
GTMetrix is one of the best performance analysis tools for websites invented by GT.net. The main purpose of GTMetrix is to analyze the performance of websites and provide a list of actionable recommendations on how to improve them. On top of that, it comes with a grading system and scores for website performance, along with warnings about problematic areas of websites.
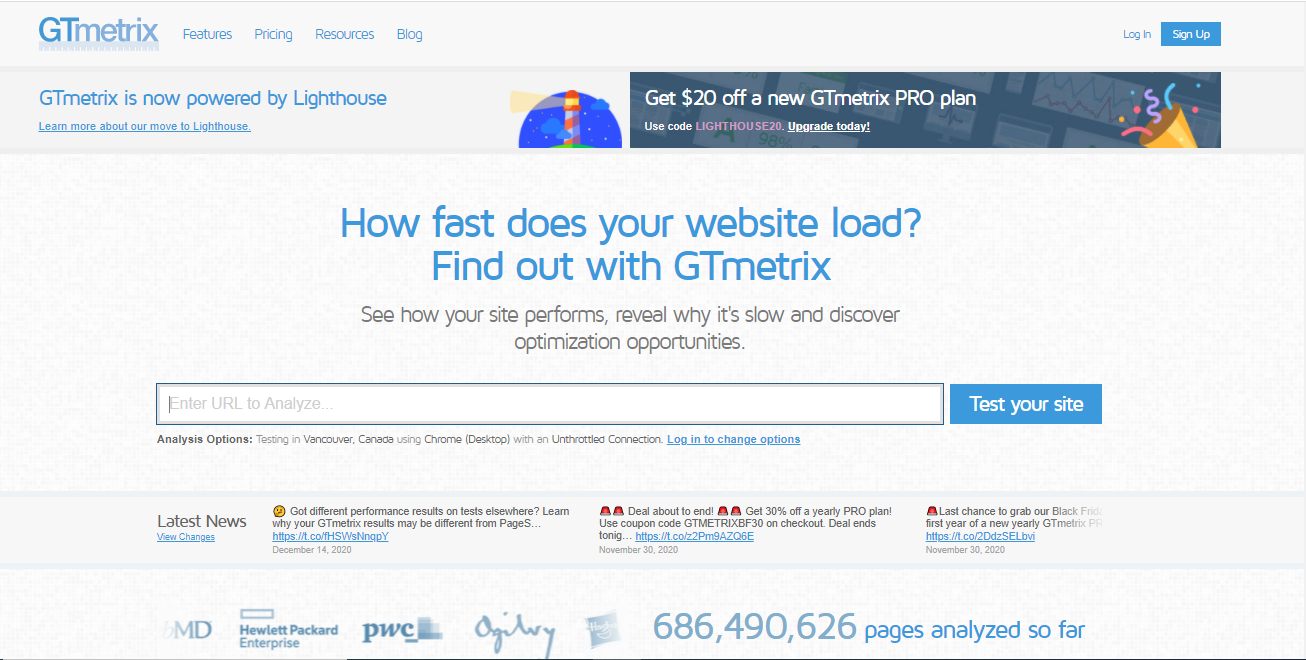
GTMetrix uses an extensive range of page speed optimization factors in order to analyze the speed and performance of websites on both desktop and mobile. The free version of this tool comes with basic features. Businesses with multiple websites and digital advertising companies that can benefit from the faster analysis can unveil advanced features by opting for paid plans.
In order to analyze your site with GTMetrix, all you have to do is provide the URL of your website, and GTMetrix will generate a comprehensive performance report. This report includes statistics and certain recommendations you can follow in order to boost your website’s performance. It also shows you various performance metrics which are very helpful in identifying what makes your website slow and how to fix those issues.
GTMetrix’s integration with Google Lighthouse
Until recently, GTMetrix has been using a combination of PageSpeed and YSlow libraries to generate scores and recommend best practices for web performance. Although these two libraries are superb in assessing how well the website is built and optimized for speed, they don’t measure the site’s actual performance and loading speed for real users.
To address this issue, GTmetrix updated its algorithm to incorporate the latest Lighthouse metrics by Google, which uses field data generated by Chrome User Experience Report (CrUX). The new version of GTmetrix with this update was announced in November 2023. It introduces a new GTmetrix grade, along with new performance and structure scores.
Major features of GTMetrix
There are heaps of impressive features of GTMetrix which benefits its users in many ways. Among them, the major ones are as follows.
Testing websites in multiple global test regions
GTMetrix has 13 servers around the world which are located in 7 regions. To date, the regions where GTMetrix servers are situated are Vancouver- Canada, London – UK, Dallas – USA, Sydney – Australia, Sao Paulo – Brazil, Hong Kong, and Mumbai – India.
There’s no need for users to worry about location and logistics as a limitation on how GTMetrix works when testing their websites. Tracking multiple URLs can be achieved through a single location.
Extensive report generation
GTMetrix generates a comprehensive report with a summary of your website performance. Especially on the below aspects,
- Page load times
- Page size
- Total number of requests
- Page performance
Web performance tracking
GTMetrix gives you the ability to monitor the performance of your website in real-time. It offers features related to that such as,
1. Scheduled performance monitoring
Website monitoring is facilitated by GTMetrix and can be performed according to your preferred schedule. The tests can be run either on a daily basis or periodically, such as weekly and monthly. It enables you to identify issues as soon as they arise and foresee future issues and take necessary actions on them even before they occur.
2. Setting alerts and notifications
GTMetric allows sending alerts and notifications on important activities of your website performance. You can place alerts and can be notified about different performance metrics like Performance and Structure scores, total page size, page load speed, and the total number of server requests.
3. Performance history.
This feature is important if you wish to check your site’s performance over a specific period of time. For that, there’s no need to traverse through a lengthy list of activities under the history tab. GTMetrix gives the facility to set a date range so that you can view only the data you require.
4. Interactive graphs.
GTMetrix allows website owners and developers to visualize website performance using four types of graphs. Namely, they are Performance and Structure scores, web vitals, load times, and server request counts.
5. Page load Times
This is the average amount of time taken by a web page to fully load with all the images and other resources. This is a significant number when it comes to the performance of your site.
6. Page size and Number of requests
Page size refers to the size of the web page when it’s fully loaded. Everything on the page from images, stylesheets, scripts, and even external resources counts to the total page size. The number of requests generated on your webpage also impacts the loading speed of your website.
Live mobile performance testing
With the increased use of mobile devices browsing the internet for various activities and transactions, it is critical to make sure that your site is optimized for mobile platforms. GTMetrix enables users to know if their website is performing well on mobile devices as well as on desktops. It passes the URL of the website through a real Android device and provides you the true performance details of the page load on mobile devices.
Video playbacks of page loads
GTMetrix allows you to view videos that show playbacks of your webpage load. This will make the performance monitoring more real and help you to get a clear idea of how pages are performing in terms of speed. As a result, you will be able to precisely identify the areas with performance bottlenecks or where the loading stops
Even Though other performance testing tools also have video playback features, GTMetrix offers more functionality with the following capabilities,
- Instead of watching the whole loading process to find out what you’re searching for, you can choose to just pinpoint the main milestones of page load history and jump to them straight away. This saves much time and effort.
- You can slow down the playback to get a better vision of how the page loads. Since it is possible to miss something crucial at normal speed, the playback can be slowed down up to 4x slower in order to evaluate it better.
- The filmstrip view of GTMetrix enables a user to view a frame-by-frame playback of the whole video. Just like slowing down, this feature also gives high chances of recognizing problematic areas.
- The playback facility also helps to provide a depiction of how the web page performs on mobiles allowing you to video capture the way it loads on a mobile device.
Maintaining data Archives
Users can keep the GTMetrix reports which they have saved for a longer period as they want. It is also convenient to track all the pages which are being monitored with GTMetrix’s weekly email digest feature. It provides users with an overview of all the major and useful data in their inbox.
GTMetrix also gives the ability to save a video of the webpage load which triggered at any monitored alert. This option is limited only to users with GTMetrix Pro accounts.
Analysis using variable factors
Webpage performance is affected by different factors like connection speed of the user, the type of the browser used, the effect of ads loading on pages, etc. GTMetrix takes all these things into account when analyzing websites for performance.
There are several browsers that are widely used by visitors. Two of them are Google Chrome and Mozilla Firefox. This tool analyses how your website performs on both browsers offering you a clear comparison on which browser your site performs better and loads faster.
GTMetrix also tests your web pages in different connection speeds ranging from Dial-Up to Cable and Broadband using its simulations. This enables you to optimize your website in a way it can be easily and fastly accessed by visitors despite their connection speed.
Authentication and security features
For websites with user logins, GTMetric inserts cookie session data so as to scan and measure its performance. GTMetrix follows the same approach for webpages with HTTP authentication.
This tool also comes with a feature to whitelist or blacklist resources. You can use blacklist for the resources you want to block from loading on the webpage (which makes the page load slower) during the test while whitelist is for the resources which are allowed to be loaded. The ability to well define and differentiate the resources using these lists will smoothen the constant monitoring of your webpage performance.
How to Run a Speed Test With GTmetrix?
GTmetrix is a very convenient tool. In order to run a GTMetrix speed test, you just have to go to the GTmetrix homepage, enter the URL of the site you want to test, and click Test your site,

But before that, if you want to change the configuration of the test, you should register for a free GTMetrix account. With the free version of the tool, your speed test will always use the following default configuration.
- Test from Vancouver, Canada
- Chrome browser on desktop
- With unthrottled connection
After login into your free account, you can change the above configurations according to your needs. For that, click on the ‘Analysis Options’ button which is located below the ‘Analyze’ button. That option will be available only if you have signed up with a GTmetrix account.

Analysis options
Once you click on the ‘Analysis Options’ button, you will be given several analysis options as shown on the following screen.
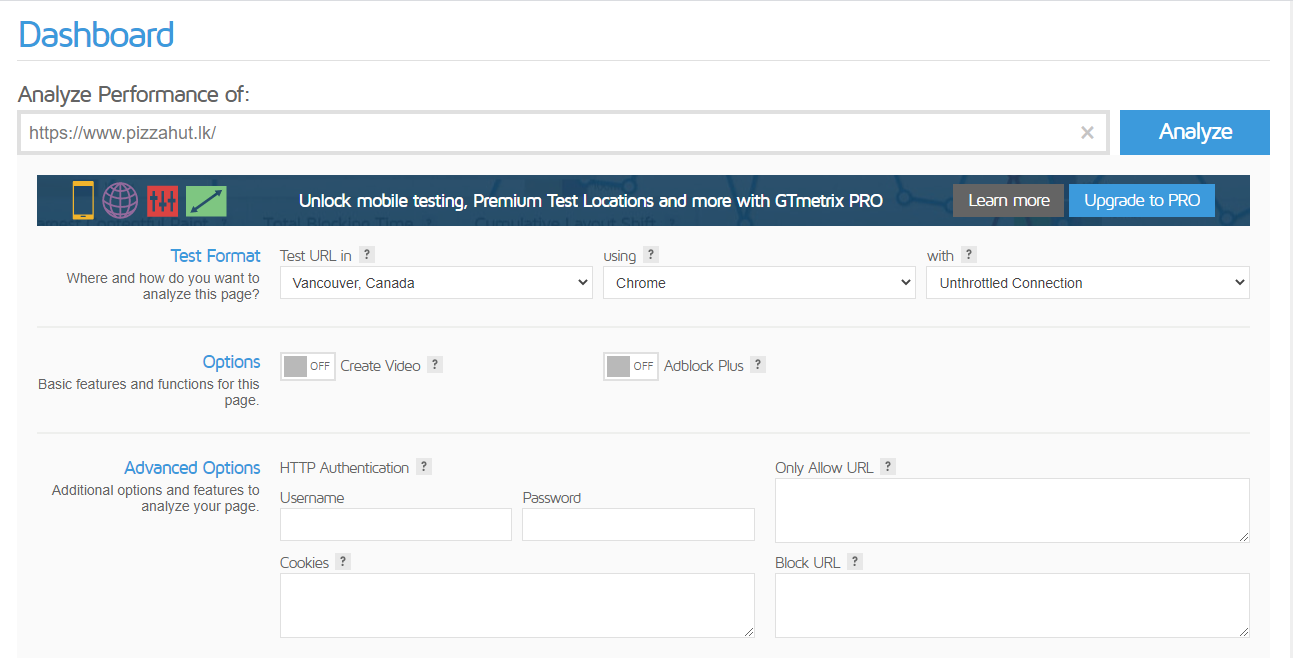
As the first option, you will be able to pick the test location within 30 test servers scattered across six regions of the world. Some of them are listed below,
- Vancouver, Canada
- Dallas, USA
- São Paulo, Brazil
- London, UK
- Mumbai, India
- Hong Kong, China
- Sydney, Australia
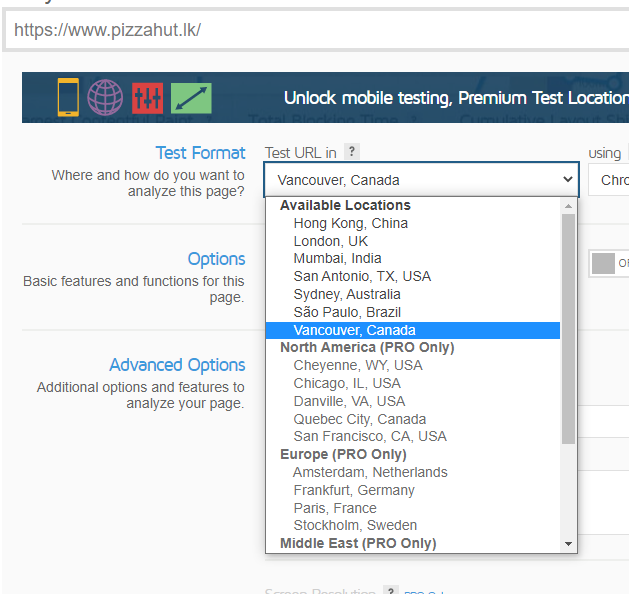
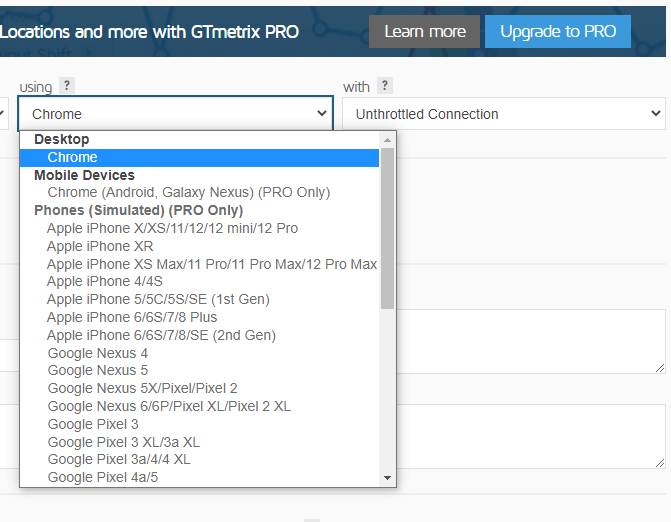
Besides changing the test location, you can also choose to test performance with specific browsers like Chrome, Firefox, or mobile test device.
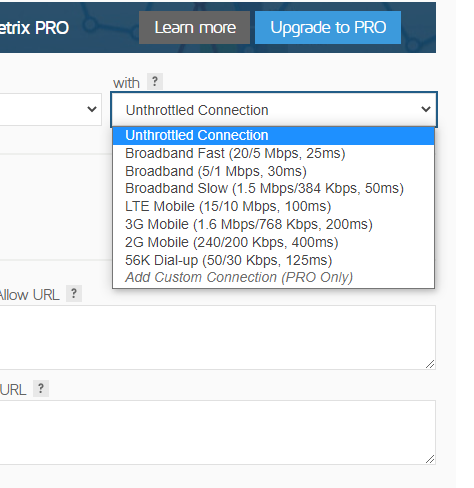
Moreover, you can select different connections to test which range from 56k Dial-up to unthrottled connections.
Below the above options, you can find some additional options, such as creating a video of how the page loads or blocking loading ads on the tested page. You can even set the test to stop right after the window Onload event. That is exactly when the webpage processing has completed.

When it’s all set to run the test, simply click Analyze, and then you will be offered a comprehensive performance report with,
- A quick summary at the top which contains the performance scores and key performance metrics
- Beneath that, comprehensive results divided into six tabs
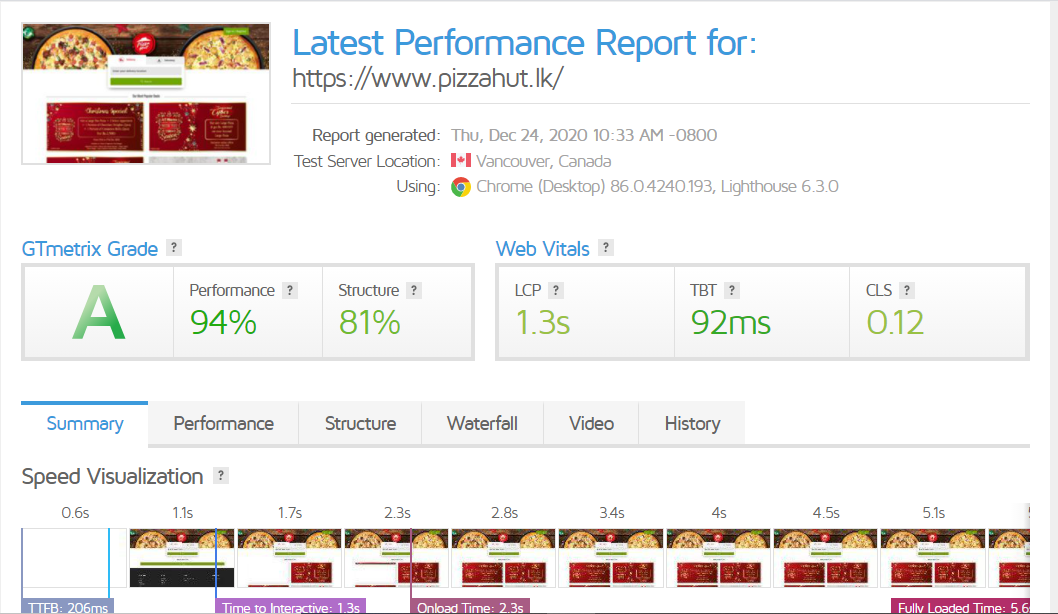
Summary of GTMetrix ( Performance scores and other metrics)
The GTMetrix summary basically includes the GTMetrix grade and web vitals. GTMetrix grade is calculated using two metrics which are Performance and Structure. GTMetrix performance is the score generated by the Lighthouse website audit tool while GTMetrix structure is a proprietary performance metric that evaluates the overall performance of a web page.
When considering web vitals, it consists of a set of web performance standards introduced by Google and user experience metrics. Web Vitals includes a variety of metrics, but GTMetrix only considers the following three metrics.
Largest Contentful Paint (LCP)
This is the amount of time taken to render the largest element of your page. LCP is considered as good if it is below 2.5 seconds and as poor if it is above 4 seconds.
Total Blocking Time (TBT)
TBT is the amount of time a page is blocked until a user can interact with it. Render-blocking JS and CSS can have a high impact on TBT.
Cumulative Layout Shift (CLS)
CLS refers to the moving of elements while the page is loading. It measures the visual stability of a webpage. If the CLS score is less than 0.1, it is considered to be delivering a fine user experience while a CLS score of 0.25 and above is considered as poor.
The above metrics which define Core Web Vitals are capable of reflecting the user experience better. Core Web Vitals score will play an important role in Google’s page ranking algorithm from May 2023. Thus, they are essential for the SEO of your website and all site owners should pay attention to them.
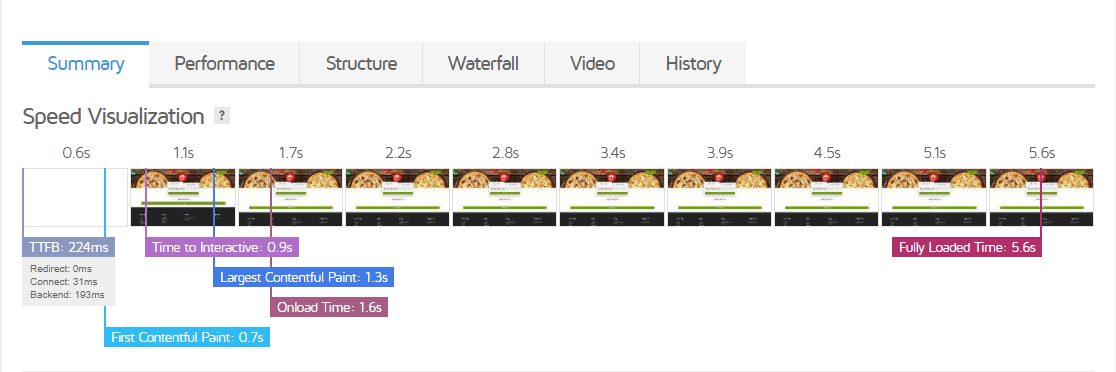
The GTmetrix summary also includes a speed visualization that displays a timeline of major events while the page is loading. The below screenshot shows TTFB, FCP (First Contentful Paint), LCP (Largest Contentful Paint), Time to interactive, Onload time, and fully loaded time for the analyzed site.
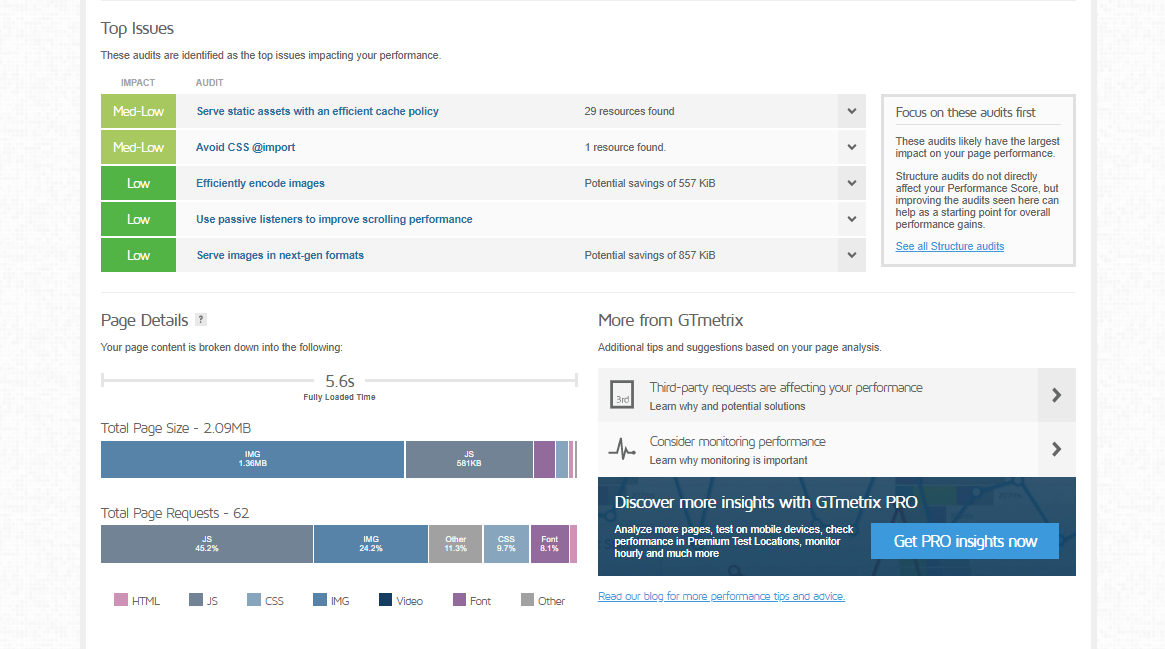
At the bottom of the summary page, you can find the ‘Top Issues‘ and ‘Page Details‘ sections. Under top issues, there is a list of high priority items that should be immediately fixed. Page details section shows a breakdown of the percentage and file size of your web page.
Other results of the GTMetrix report (6 tabs)
The six tabs of the GTMetrix report cover different areas with each including different tips to improve your site performance. Let’s go through them,
Performance
The ‘Performance tab’ displays a number of useful metrics retrieved by Lighthouse performance data. In addition to the web vitals shown on the summary page, the performance tab also shows Speed Index (SI), Time to Interactive (TTI), and First Contentful Paint (FCP).
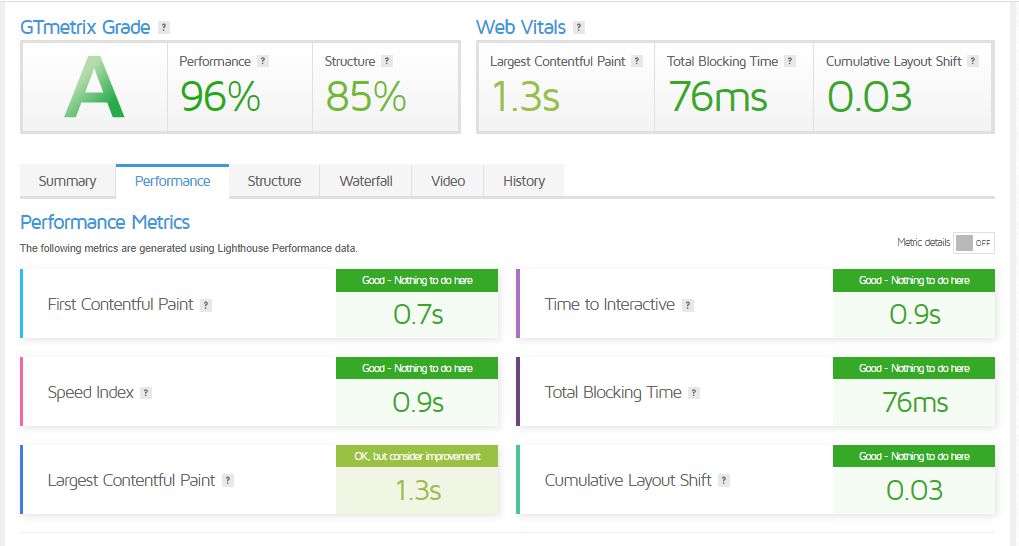
Even though the performance tab doesn’t directly indicate what needs to be fixed, it gives a nice overview of the main user experience metrics which you can improve on.
At the bottom of the tab, there are also a few more traditional ‘Browser Timings‘ statistics like Onload Time, Fully Loaded Time, Time to First Byte, and so on. Earlier, these traditional metrics were very important. But later, with Google directing towards standard metrics with Web Vitals, it’s better to optimize for them instead. In many cases, you will see that optimizing for Web Vitals also helps to reach high browser timing metrics.

Structure
The ‘Structure tab’ is the place where GTmetrix lists various issues that affect the performance of your website. This tab is very helpful as it offers you actionable recommendations like avoiding render-blocking resources, minifying CSS and JS, etc.. which you can use to start optimizing your site straight away.
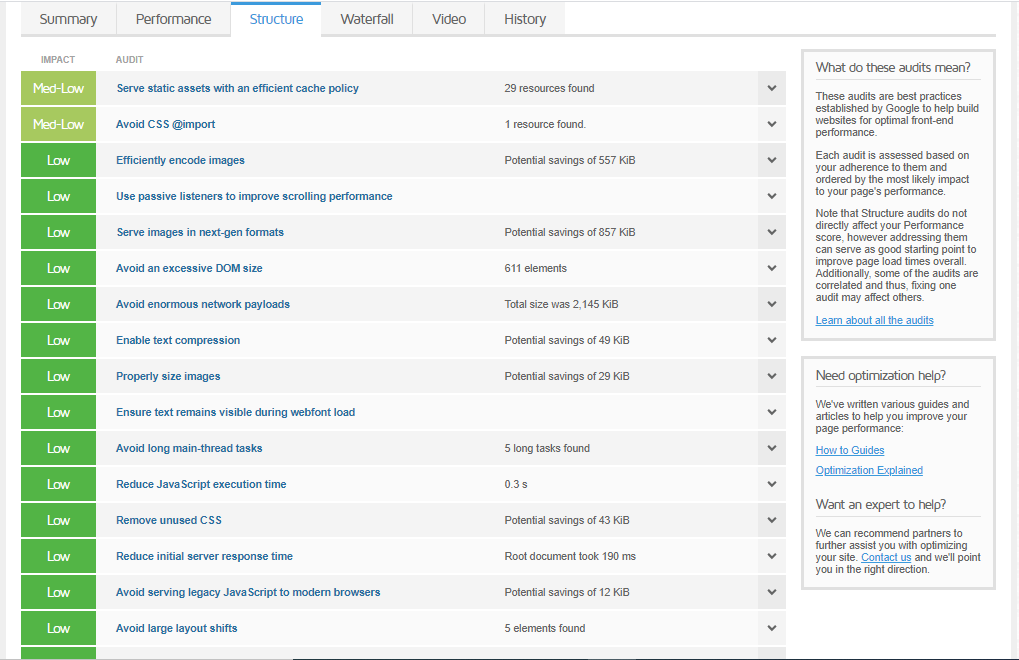
Some of the most common and popular performance issues which WordPress site owners are struggling with can be listed as below,
- Leverage browser caching
- Serve scaled images
- Inline small CSS
- Inline small JavaScript
- Serve resources from a consistent URL
- Defer parsing of JavaScript
- Minify CSS and JavaScript
- Optimize images
Waterfall
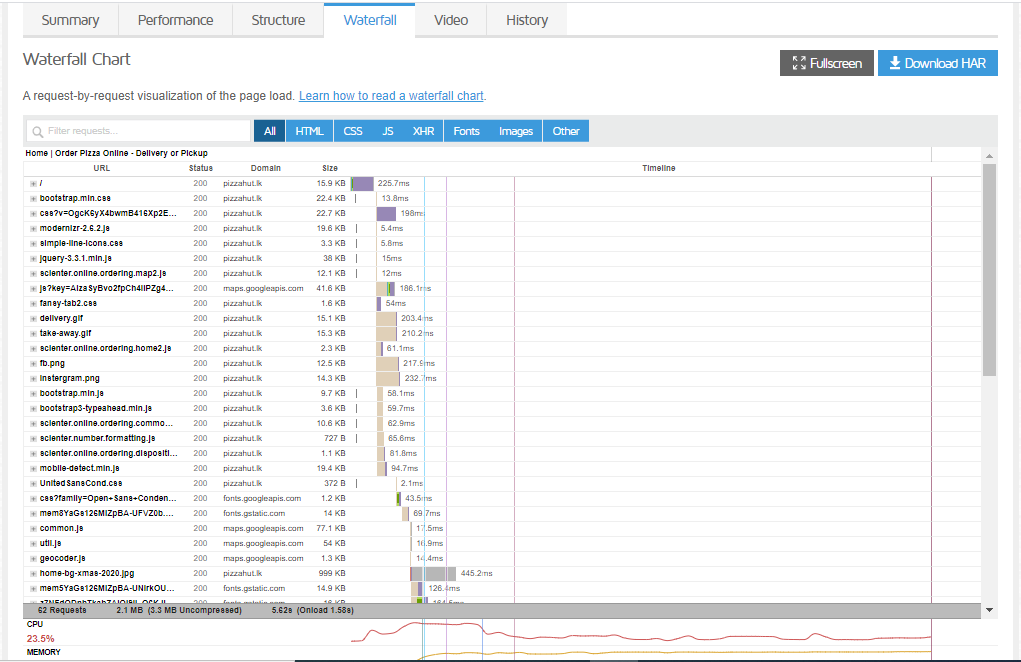
The ‘Waterfall tab’ shows you the amount of time taken by each resource to load. When you click on the Waterfall tab, you’ll see a list of every single HTTP request for the tested web page, each request consuming a different amount of time to load and loading in a different order. Therefore, if you can detect and remove those slow-loading HTTP requests, it will make a significant improvement in your website speed.
Inspecting this tab will also give you an understanding of the resources which need to be optimized. For instance, if an image file takes more time to load, you can reduce its size using an image optimizer and improve loading speed.
This tab is a bit advanced, yet very useful for understanding how different parts of your website load and identifying the performance bottlenecks which slow down the entire site.
Timings
The ‘Timings tab’ gives you more information related to the loading process such as how long it takes to reach different load time metrics. This information can also be found in the Waterfall chart and the Timings tab just makes it easier to visualize.
The timings tab will display and take the following facts into consideration.
- Time to first byte (TTFB)
- First contentful paint
- Largest contentful paint
- Time to interactive
- Onload time
- Fully loaded time
You can find out more detailed descriptions about each point by hovering over those metrics.
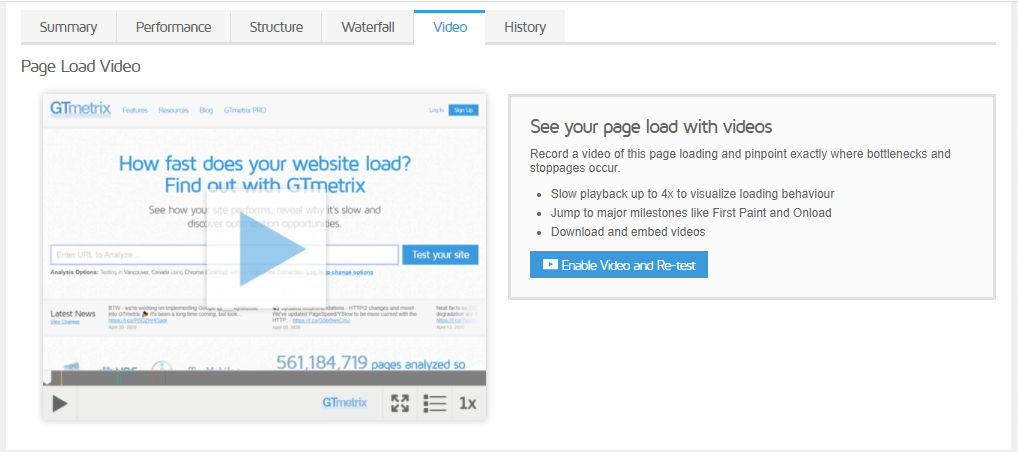
Video
This tab will present you with a video of the entire loading process of your website. If you enabled page load videos before starting the test, you can view them in the Video tab. There, you can visually spot which components of the page take more time to load. You’ll also be able to slow down the video up to 1/4th the original speed to view things in more detail. You can even download the video if you want to keep a record of the site performance on each test.
Videos are useful because they allow you to see how your site loads, which parts of the site appear first? Are there any weird defects during loading like a flash of unstyled content? These are all useful things to know when optimizing websites for performance.
History
If you test a web page multiple times, the History tab enables you to see the results of previous tests making it easier to analyze the way things have changed over time. You can observe the changes in page load speed, page size, and the PageSpeed and YSlow scores.

For example, if you make some adjustments to the site to improve its GTmetrix score, you will be able to see how those changes have affected actual page load times.
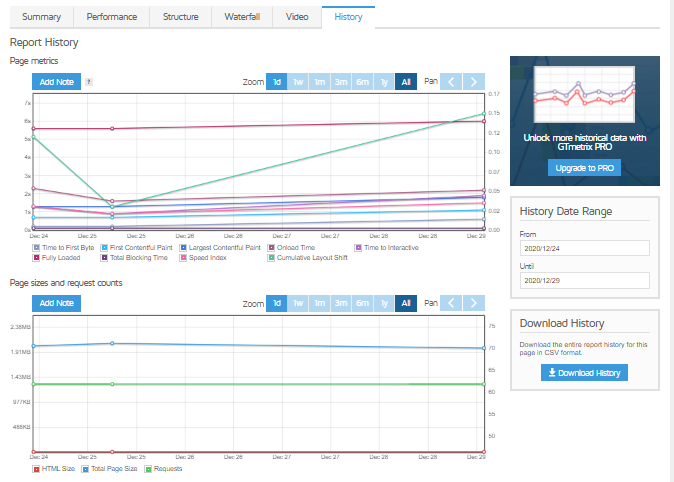
GTMetrix will store all tests for a specific page for 30 days. After that, the historical details of the test results will be deleted.
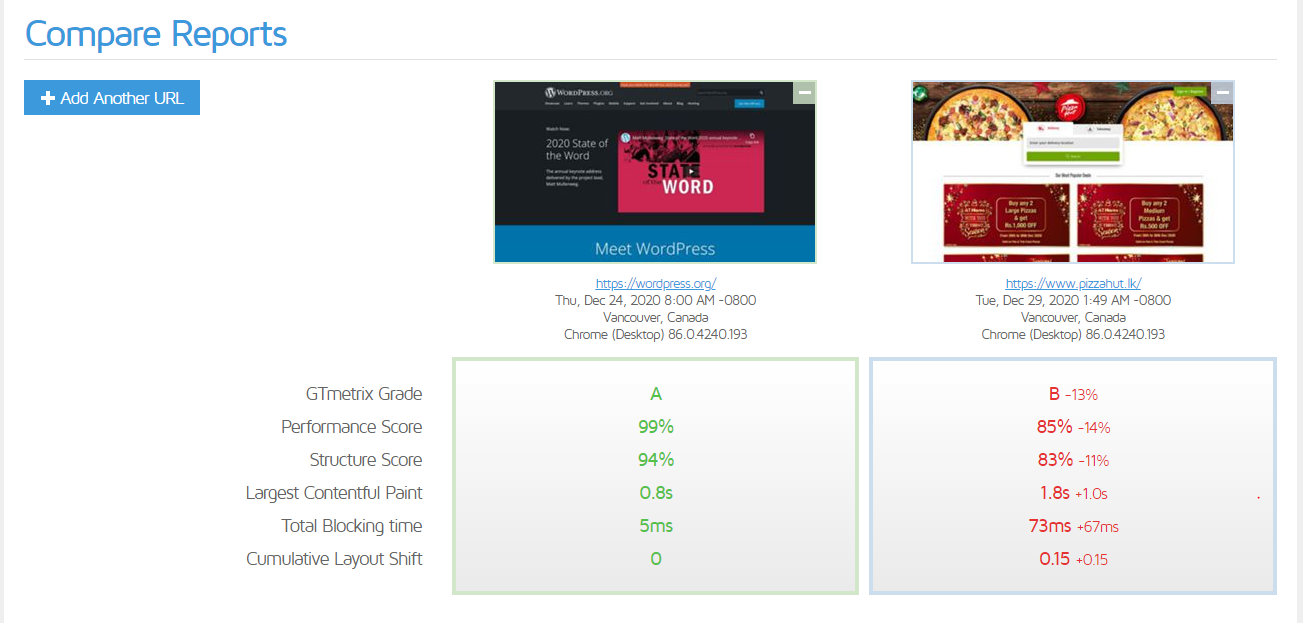
One really awesome feature offered by GTMetrix is the ability to select and compare past reports side by side. This feature is really helpful when you are optimizing your site to check if there are any improvements.
How to improve performance metrics?
Now you have learned how your site needs to be improved, So let’s apply some of the solutions offered by GTmetrix!
Enable GZIP Compression
File size and type can affect the overall loading speed of a site. GZIP is a file format used for file compression and decompression. It reduces the size of your HTML, CSS, and JavaScript files. Some websites have shown up to 70% reductions using GZip compression. It is one of the easiest optimization methods that can be applied to a WordPress site.
Minify HTML, CSS and JavaScript
Minifying HTML, CSS, and JavaScript is another great way to increase loading speed. It will remove any unnecessary characters from the source code like white spaces, line breaks, and indents. By doing so, you can save many bytes of data and also experience fast loading with accelerated downloading, parsing, and execution time.
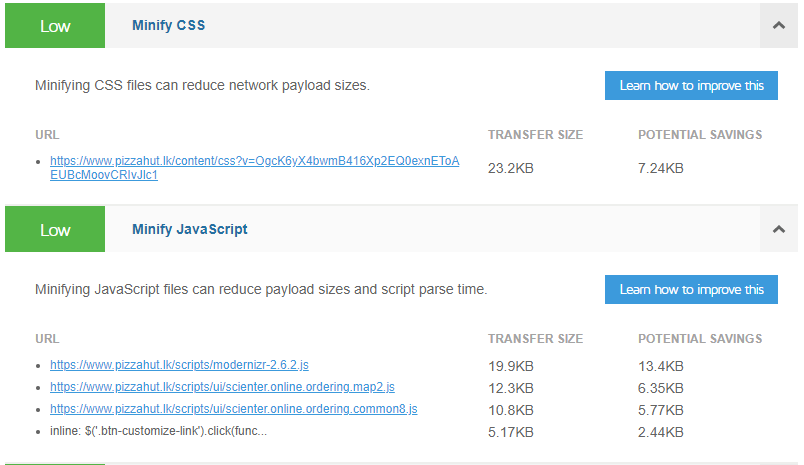
For WordPress users, this can be easily achieved by installing the free Autoptimize plugin.

Optimize Images
Images take an average of 66% of a total webpage’s weight. So when optimizing your WordPress site for performance, a high priority should be given to image optimization as it’s more important than stylesheets and scripts.

Enable Caching
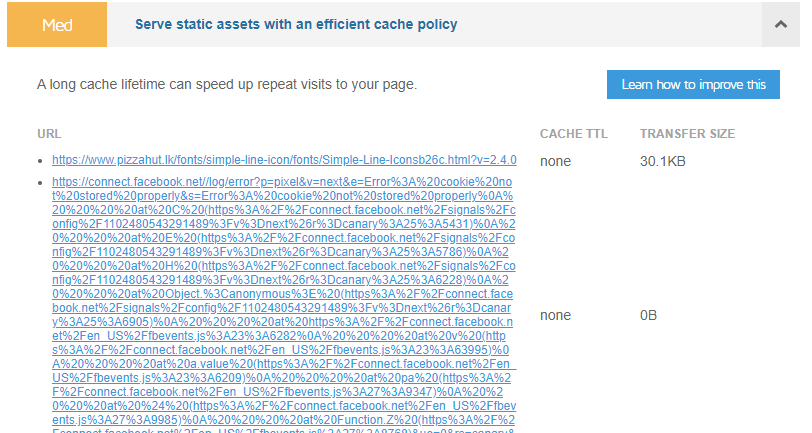
There are different types of caching which will affect your site performance like browser caching, server caching, CDN caching, etc. The status of cache on your website may impact its performance and also cause variations in the Performance Score. For WordPress website owners, there are many caching plugins available to speedup their website.
Properly resize images
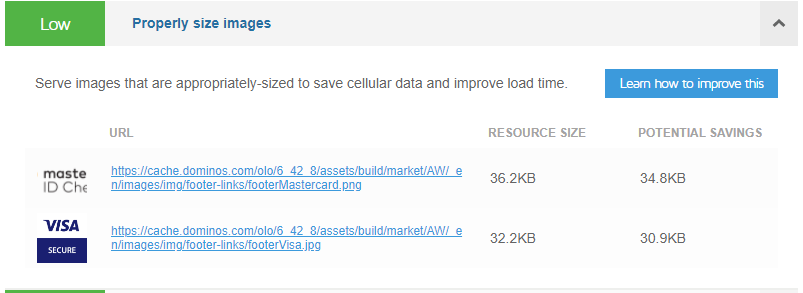
When you are uploading images to your website, you should always try to resize them into appropriate sizes without letting CSS resize them. Otherwise, you will get a ‘Properly size images‘ recommendation. If you are having a WordPress site, it resizes the images by default when you upload them to the media library. WordPress users can also automatically resize images using an image optimization plugin.
Eliminate render blocking JavaScript / CSS
By default, JavaScript and CSS are render-blocking. This means that they block the rendering of meaningful content (the First Paint) of the web page from rendering until they are parsed by the browser. Deferring them lets the browser hold the download of those JS and CSS until HTML parsing is completed.

Use inline Small CSS /JavaScript
Using inline CSS/JS is not always recommended as it causes the overall size of your page request to increase. But if your site is small and includes a small number of requests, you can improve its performance by inlining CSS /JavaScript.
WordPress site owners can easily inline their CSS/JavaScript with the use of a free WordPress plugin like Autoptimize.

Specify Image Dimensions
This refers to including width and height for all images on your website. By doing so, you can allow fast rendering as it eliminates the need for unnecessary reflows of webpages.
Important factors to consider when conducting a GTMetrix speed test
Conducting a GTMetrix speed test might not be easy as you think. You can’t simply run an individual test and expect to get accurate results and valuable insights. The key to successful and more in-depth analysis is to run multiple tests and experiment with different factors.
Below are a few essential factors to consider while running a page speed test,
Number of tests
In order to get a good and more comprehensive data set, you need to run numerous speed tests during different times in the day. It would be perfect if you can schedule an hourly test and keep it running for a week or so.
It is important to run regular tests as mentioned above because the performance of a website can vary throughout the day depending on the traffic intensity of your site. If you are on a shared host, the performance of the site will also change according to the number of resources your server can allocate to your site during different times in the day.
However, a sufficient amount of insights can be obtained by running 5 – 10 speed tests over an hour or two. The load times in seconds may change during the course of a day or a week. But many of the GTMetrix recommendations will not change with time.
Test locations
The proximity of your website to the test location has a high impact on your test results. It greatly determines how fast your site will load and how well it will perform. Therefore, it is important to pick a location that is closer to your target audience or the physical location of your web server.
However, if your audience is spread across the world, it’s better to pick four or five test locations across the globe and try to spread them out as much as possible. For instance, you can pick one server from the US, one from Europe, one from Asia, and one from Australia. Your test results will be more accurate when your test locations are more expanded.
Devices to test
Most of the Gtmetrix users only test the performance of their website on desktop devices and just ignore the mobile. But it’s a huge mistake since more than half of the traffic of the internet comes through mobile devices.
Moreover, your website speed on mobile devices can be remarkably different from desktop devices depending on the content of your website. For instance, low powered mobile devices will take more time to process and load web pages with heavy Javascript when compared to laptops and desktop computers. Therefore, if you have a site with a lot of Javascript, its mobile loading speed can be very low than the desktop loading speed.
Connection speed is also another important aspect to consider. While some visitors will use high-speed wired connections, some will browse from their mobiles using 4G leading to slower loading times.
So, in order to get a clear view of how visitors experience your site, you need to test it across various devices and connection speeds. With GTmetrix, different connection speeds can be tested for free. But if you need to test using a mobile device, you will have to create a premium account.
Target pages
Your website’s performance cannot be fully reviewed by only testing the home page. Your home page can be the least data-intensive page on your site which contains less code and scripts compared to other pages showing that your website is fast.
Besides, most of the time its product pages which attract more traffic rank high in search engines. This means that the loading speed of other pages can be more important than the homepage and it’s important to focus on them too.
This is the reason why it is recommended to test all the inner pages of your website like product pages, blogs, product category pages, and so on in addition to the homepage.
GTMetrix Plans
As mentioned previously, the basic plan of Gtmetrix is free unless you want to unlock more features with advanced functionality. If you need more features, you have the option to sign up for a GTMetrix Pro plan. There is also a bundle of add-on features that are commonly available for all Pro users. Below are all available GTMetrix plans with a brief description of the features they offer.
Basic
This is the free plan of GTMetrix which lets users monitor a maximum of three URLs with an archive of 20 URLs. It grants 20 daily API credits and also enables users to quickly search for reports using custom filters.
Bronze
The bronze package enables you to get more out of the primary features. Users can monitor up to 10 URLs and manage an archive of a maximum of 100 URLs. It comes with a 100 daily API credit limit, the ability to create custom filters for report filtering, and add-on features.
Silver
The Silver account has more offerings such as monitoring up to 20 URLs and maintaining an archive of up to 200 URLs. It allows 500 daily API credits, unlimited custom filters plus add-on features.
Gold
The Gold account is more expensive than all the others but there are absolutely more exceptional features. It grants you a daily API credit limit of up to 1500 and allows you to create unlimited custom filters. You can track up to 50 URLs while maintaining an archive of up to 500 GTMetrix reports.
Apart from the add-on features that all pro plans have, the Gold account also allows users to create white-labeled PDF reports which can be customized with their company logo and brand name.
Custom
This is certainly the most flexible plan out of all plans. Here, the users get more freedom in selecting the features which they want such as the number of URLs to monitor and URLs to maintain in the archive, the number of daily API credits, and the number of customizable report filters.
They will also enjoy all the add-on features available for other premium users.
Wrapping Up
GTMetrix is an awesome speed analysis tool as it shows ‘Real World Numbers’ about the performance of your website. This tool can be very effectively used to identify performance-related issues and fix them. Furthermore, it’s easy configuration options make the user experience with GTMetrix more complete and reliable. It helps to turn a frustratingly slow website into an amazingly fast and high-performing website giving you more visitors, conversions, and higher search engine rankings.

